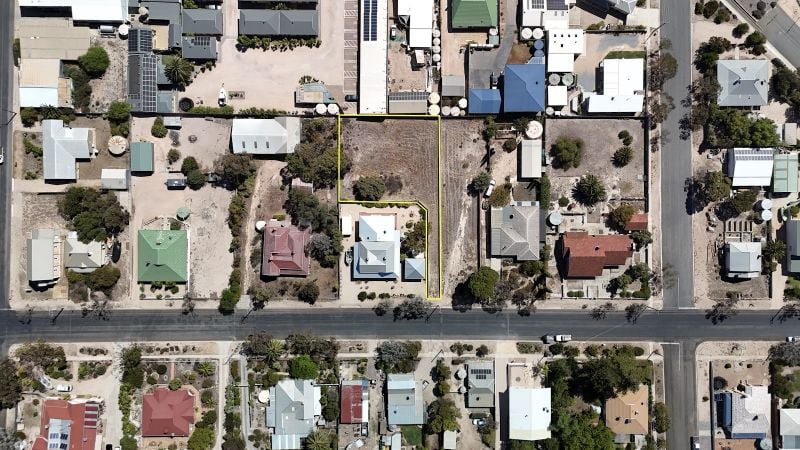
55 Amsterdam CrescentSalisbury Downs SA 5108
Contact agent to arrange an inspection.
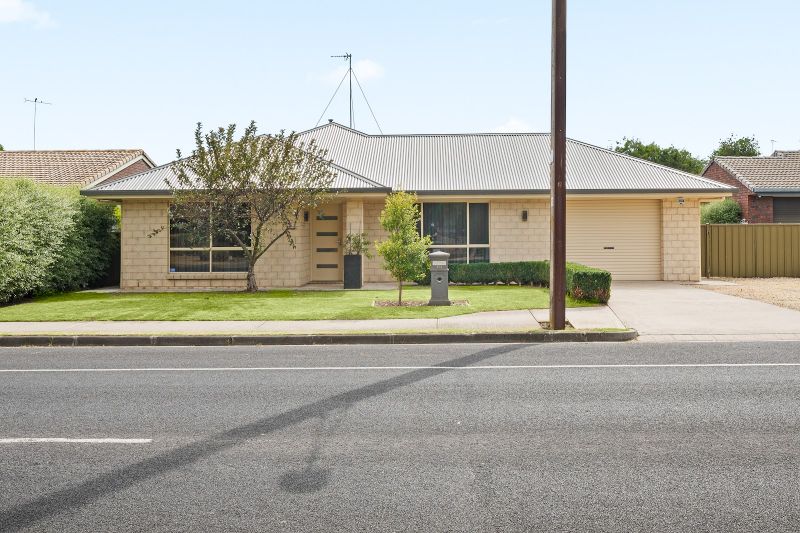
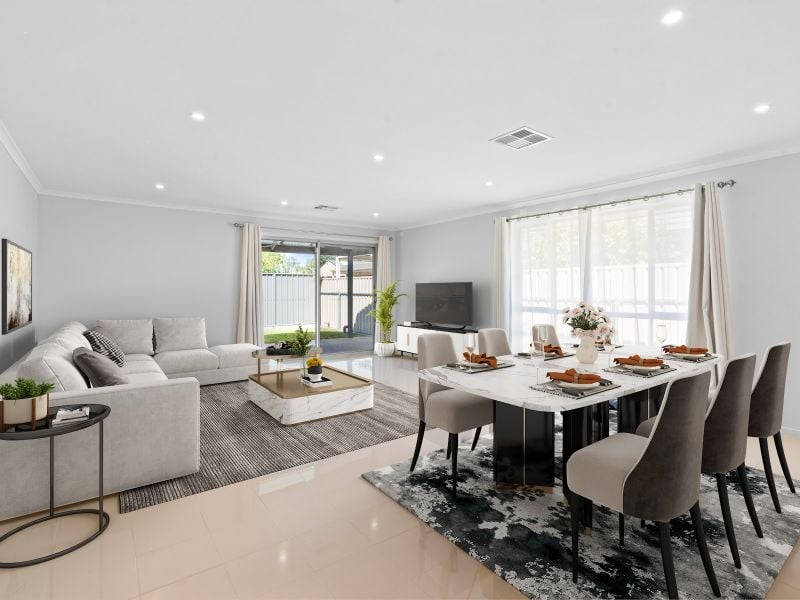
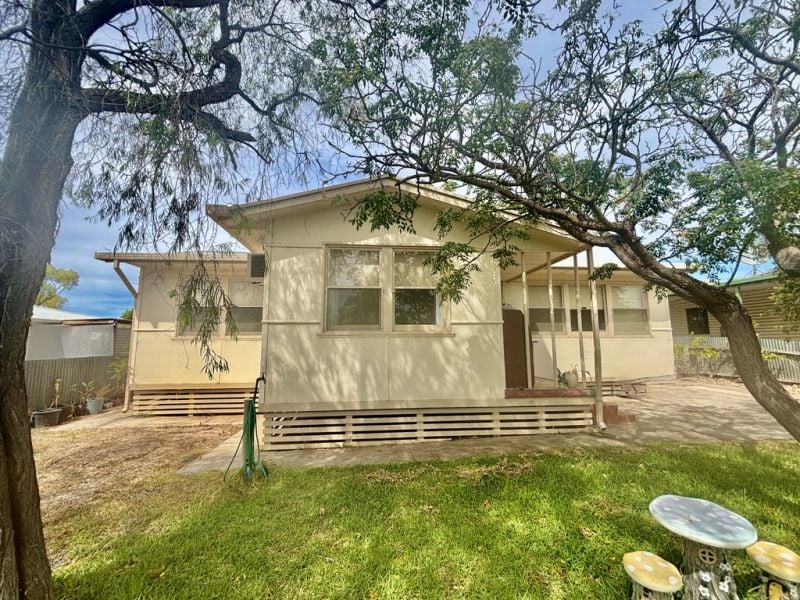
Well Presented Home on Corner Block
Property Details for 55 Amsterdam Cres, Salisbury Downs
55 Amsterdam Cres, Salisbury Downs is a 3 bedroom, 1 bathroom House with 4 parking spaces. The property has a land size of 639m2 and floor size of 113m2. The place is currently for sale with @realty.
Other properties by this agency
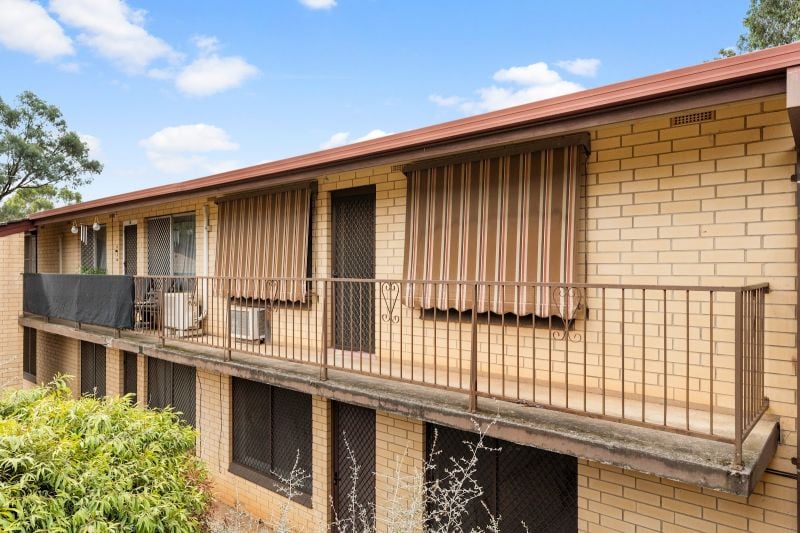
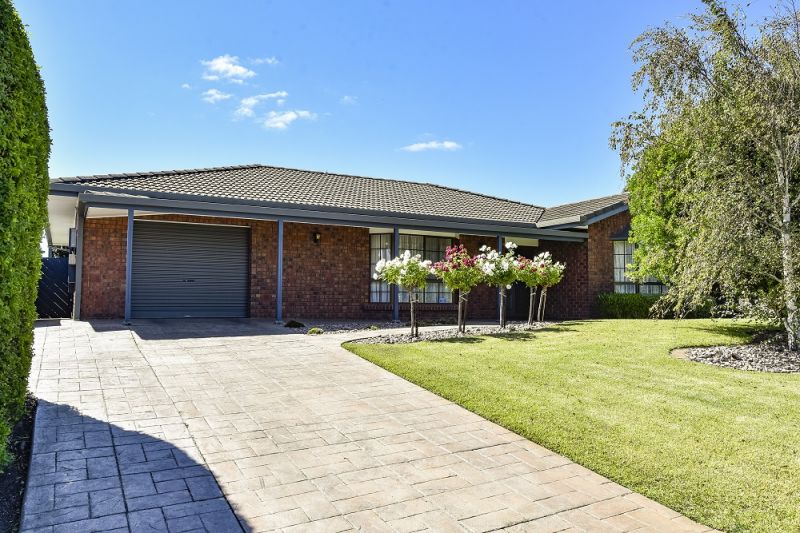
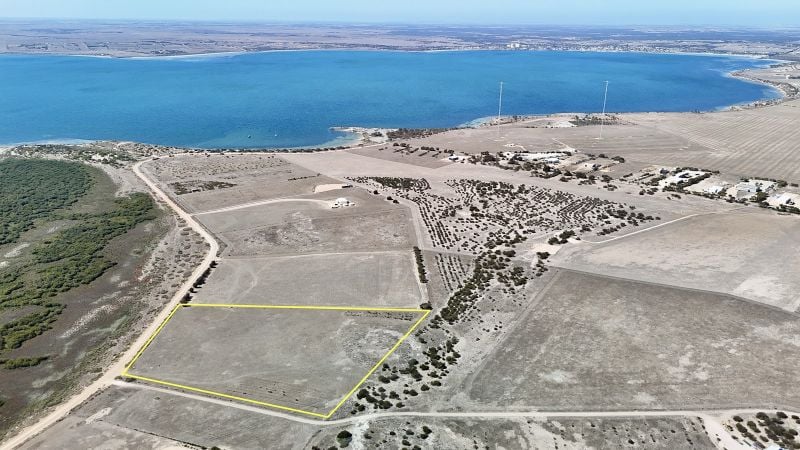
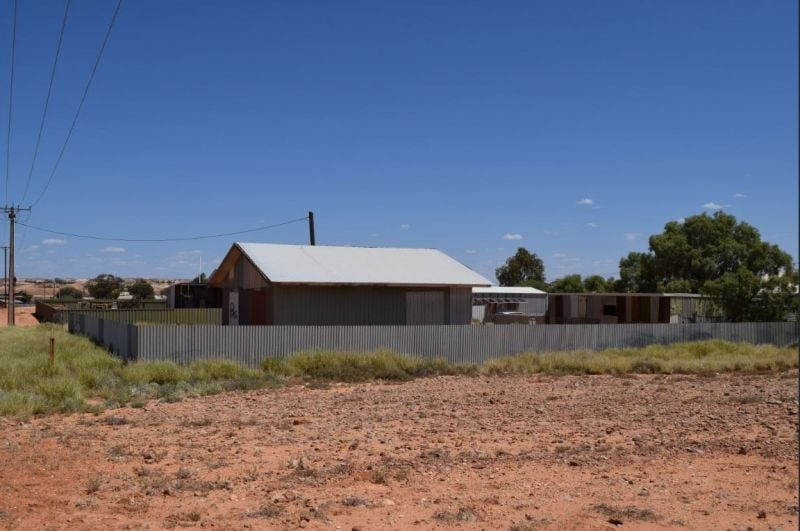
Recent Sales by this agency
About Salisbury Downs 5108
The size of Salisbury Downs is approximately 2.8 square kilometres. It has 16 parks covering nearly 13.5% of total area. The population of Salisbury Downs in 2011 was 5,258 people. By 2016 the population was 5,973 showing a population growth of 13.6% in the area during that time. The predominant age group in Salisbury Downs is 20-29 years. Households in Salisbury Downs are primarily couples with children and are likely to be repaying $1000 - $1399 per month on mortgage repayments. In general, people in Salisbury Downs work in a labourer occupation. In 2011, 60.4% of the homes in Salisbury Downs were owner-occupied compared with 60.2% in 2016.
Salisbury Downs has 2,706 properties. Over the last 5 years, Houses in Salisbury Downs have seen a 122.71% increase in median value, while Units have seen a 114.03% increase. As at 28 February 2025:
- The median value for Houses in Salisbury Downs is $646,280 while the median value for Units is $450,856.
- Houses have a median rent of $550 while Units have a median rent of $290.
What's around 55 Amsterdam Cres, Salisbury Downs
55 Amsterdam Cres, Salisbury Downs is in the school catchment zone for Parafield Gardens High School.


Suburb Insights for Salisbury Downs 5108
Market Insights
Salisbury Downs Trends for Houses
$646k
18.49%
View Trend$550/W
4.58%
Salisbury Downs Trends for Units
$451k
28.79%
View TrendN/A
N/A
Neighbourhood Insights
Age
Population 5,973
0-9
14%
10-19
12%
20-29
15%
30-39
13%
40-49
12%
50-59
13%
60-69
11%
70-79
6%
80-89
3%
Household Structure
Occupancy
© Copyright 2025 RP Data Pty Ltd trading as CoreLogic Asia Pacific (CoreLogic). All rights reserved.
This product uses cookies and other similar technologies to improve and customise your browsing experience, to tailor content and adverts, and for analytics and metrics regarding visitor usage on this product and other media. We may share cookie and analytics information with third parties for the purposes of advertising. By continuing to use our website, you consent to cookies being used. View our Privacy Policy here.
X