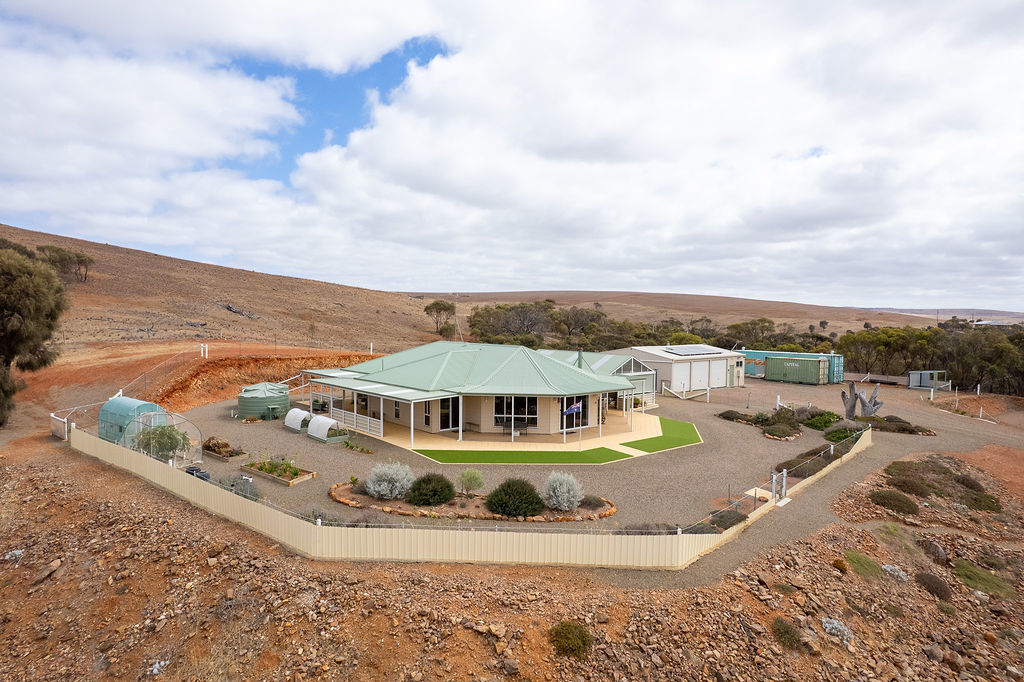
FOR SALE
$1,460,000 ($1,800per arable acre)

74 Humphries Road
Darke Peak SA 5642

Bedrooms: 4
Bathrooms: 2
Car spaces: 2
Land area: 338.73ha
Inspection Times
No upcoming inspections scheduled.
Contact agent to arrange an inspection.
Save

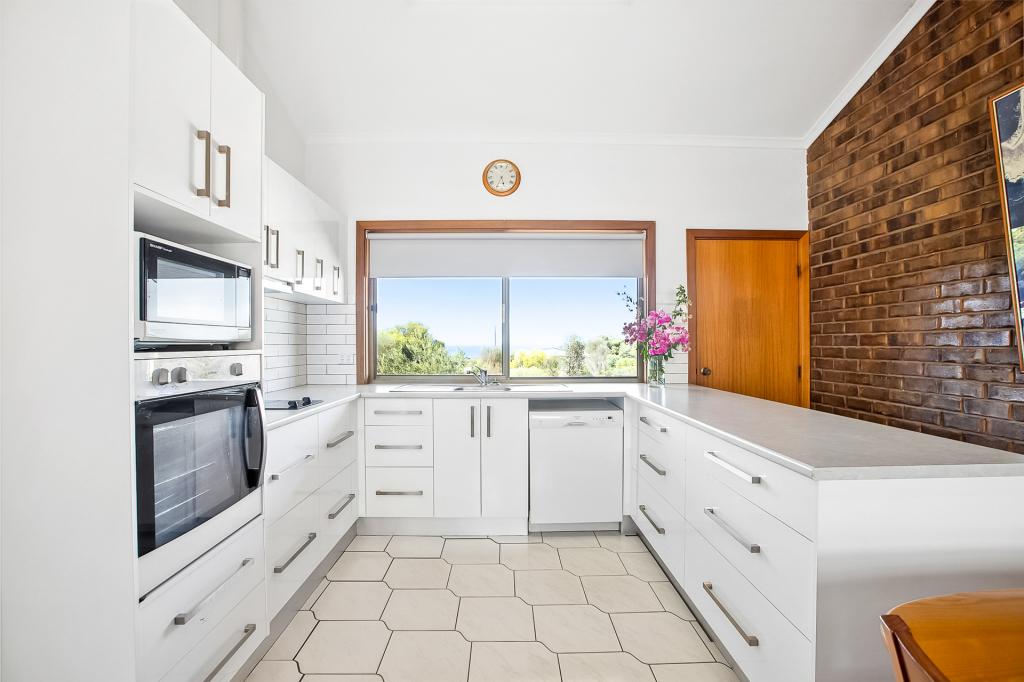
LYNWOOD - Mixed Farming

Located in the heart of Darke Peak, 47kms northwest of Cleve, 26kms north of Rudall and 51kms south of Kimba on the Eyre Peninsula.
Total Land area: 338.73 hectares (837.0 acres) with approximately 329 hectares (812 acres) arable for cropping.
The farming practices consist of mostly cereal crops and sheep grazing.
The land consists of plains and gentle slopes with sandy loam over calcareous gradational clay loam soils.
Fenced into 7 main paddocks with cyclone and wooden posts with some supporting steel droppers.
There are a number of machinery sheds, implement sheds, workshop, shearing shed with sheep yards, cattle yards, 70 tonne roll-top super shed and a number of grain silos and fuel tanks.
The brick and tile house features 4 bedrooms with the master bedroom including walk through robe and en-suite. There is a sunken lounge with built in bar, entertaining room, bathroom, upgraded kitchen and dining area, laundry and 2 single carports.
There is mains water available to troughs and rainwater for the houses.
The average annual rainfall is approximately 350mm with approximately 75-80% falling between the April to October growing season.
To request an Information Memorandum, please contact the agent.
See More

Property Details for 74 Humphries Rd, Darke Peak

Building Type
Rural
Land Size
338.73ha

Commute Calculator

Where to?
-
-
-
-

About Darke Peak 5642

The size of Darke Peak is approximately 461 square kilometres. It has 3 parks covering nearly 3.4% of total area. The population of Darke Peak in 2011 was 271 people. By 2016 the population was 78 showing a population decline of 71.2% in the area during that time. The predominant age group in Darke Peak is 50-59 years. Households in Darke Peak are primarily childless couples and are likely to be repaying under $300 per month on mortgage repayments. In general, people in Darke Peak work in a managers occupation. In 2011, 70.5% of the homes in Darke Peak were owner-occupied compared with 65.7% in 2016..

Darke Peak has 120 properties. Over the last 5 years, Houses in Darke Peak have seen a 127.34% increase in median value. As at 28 February 2025:

  • The median value for Houses in Darke Peak is $180,026.
There are currently 2 properties listed for sale, and no properties listed for rent in Darke peak on OnTheHouse. According to CoreLogic's data, 4 properties were sold in the past 12 months in Darke peak.

What's around 74 Humphries Rd, Darke Peak

Nearby Schools
Comparable Properties
Cleve Area School
35.93km
Cleve 5640
CombinedGovernmentP - 12Combined278 Enrolled
Kimba Area School
42.14km
Kimba 5641
CombinedGovernmentP - 12Combined173 Enrolled
Lock Area School
43.62km
Lock 5633
CombinedGovernmentP - 12Combined58 Enrolled
Cowell Area School
68.98km
Cowell 5602
CombinedGovernmentP - 12Combined162 Enrolled
Port Neill Primary School
71.6km
Port Neill 5604
PrimaryGovernmentP - 7Combined7 Enrolled
Ungarra Primary School
79.17km
Ungarra 5607
PrimaryGovernmentP - 7Combined36 Enrolled
Wudinna Area School
84.26km
Wudinna 5652
CombinedGovernmentP - 12Combined201 Enrolled
Cummins Area School
97.82km
Cummins 5631
CombinedGovernmentP - 12Combined393 Enrolled
Tumby Bay Area School
99.72km
Tumby Bay 5605
CombinedGovernmentP - 12Combined200 Enrolled
Elliston Area School
123.34km
Elliston 5670
CombinedGovernmentP - 12Combined69 Enrolled

Suburb Insights for Darke Peak 5642

Market Insights
Darke Peak Trends for Houses
Median Value

$180k

6.80%
View Trend
Median Growth

17.40%

View Trend
Median Rent

N/A

-
View Trend
Rental Yield

11.05%

8.30%
View Trend
Median Value: The middle value of all properties across the geography based on the Automated Valuation Model.


Median Value over 1 year (03/24 - 02/25)
Darke Peak Trends for Units
Median Value

N/A

-
View Trend
Median Growth

N/A

View Trend
Median Rent

N/A

-
View Trend
Rental Yield

N/A

-
View Trend
Median Value: The middle value of all properties across the geography based on the Automated Valuation Model.


Median Value over 1 year
Neighbourhood Insights
Age

Population 78

0-9


12%

10-19


14%

20-29


5%

30-39


12%

40-49


8%

50-59


31%

60-69


20%

Household Structure
Occupancy
Contact agent
Luke Duncan
Show contact details
Elders Real Estate Port Lincoln
Preferred contact:
Disclaimer
Whilst all reasonable effort is made to ensure the information in this publication is current, CoreLogic does not warrant the accuracy or completeness of the data and information contained in this publication and to the full extent not prohibited by law excludes all liability for any loss or damage arising in connection with the data and information contained in this publication.
South Australia data
© 2025 Copyright in this information belongs to the South Australian Government and the South Australian Government does not accept any responsibility for the accuracy or completeness of the information or its suitability for purpose.
Valuations and Estimates
This estimate is provided by CoreLogic, and is based on statistical market data such as recent local sales, property size, number of bedrooms and many more factors. It comes from public data, which may be incomplete or inaccurate, and should not be used in lieu of a professional appraisal under any circumstances, including for lending purposes or in home loan applications.
School data and Content
Product Data licenced by CoreLogic under a Creative Commons Attribution licence. For details regarding licence, data source, copyright and disclaimers, see https://www.corelogic.com.au/legals/third-party-restrictions
ABS data
This publication contains data and statistics provided by the Australian Bureau of Statistics, available at http://www.abs.gov.au/ and reproduced under Creative Commons Attribution 2.5 http://creativecommons.org/licenses/by/2.5/au/legalcode
Liveability information
The Liveability Score is a rating (out of 10) provided by Propella.ai Pty Ltd as a guide about how "well-connected" properties are in certain local areas. The Liveability Score is based on statistical data about a local area in which a property is located including the distance to and number of available facilities and services (including schools, parklands, health services, shopping and public transport) (Liveability Data). The Liveability Data and Liveability Score has not been verified or confirmed by CoreLogic, is not available for all properties, and is of a general nature and should not be construed as specific advice or relied upon in lieu of appropriate professional advice. Given the relative nature of the Liveability Score, propella.ai anticipate that scores for individual properties will change over time.