5 Crake StreetSouth Hedland WA 6722
Contact agent to arrange an inspection.
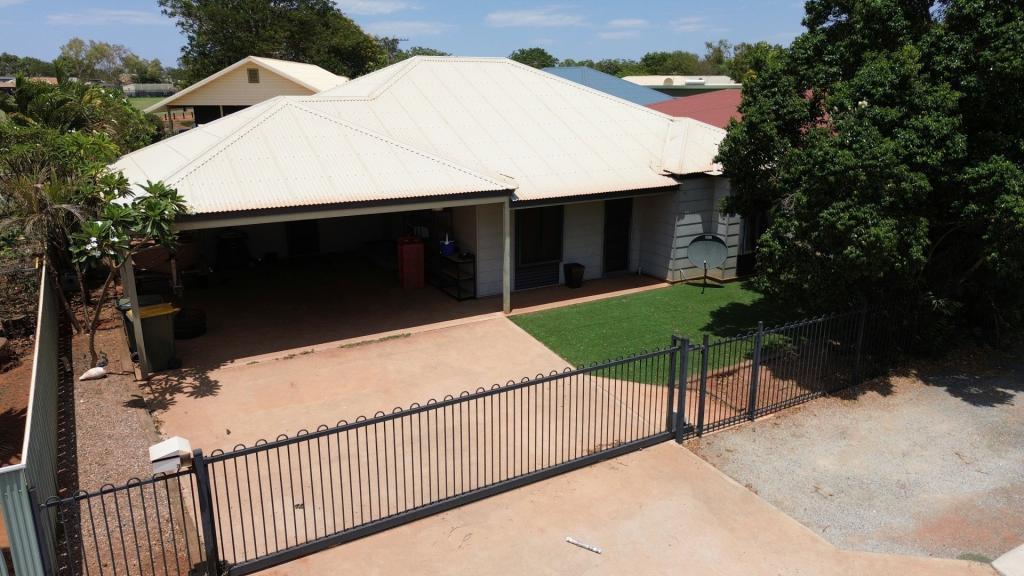
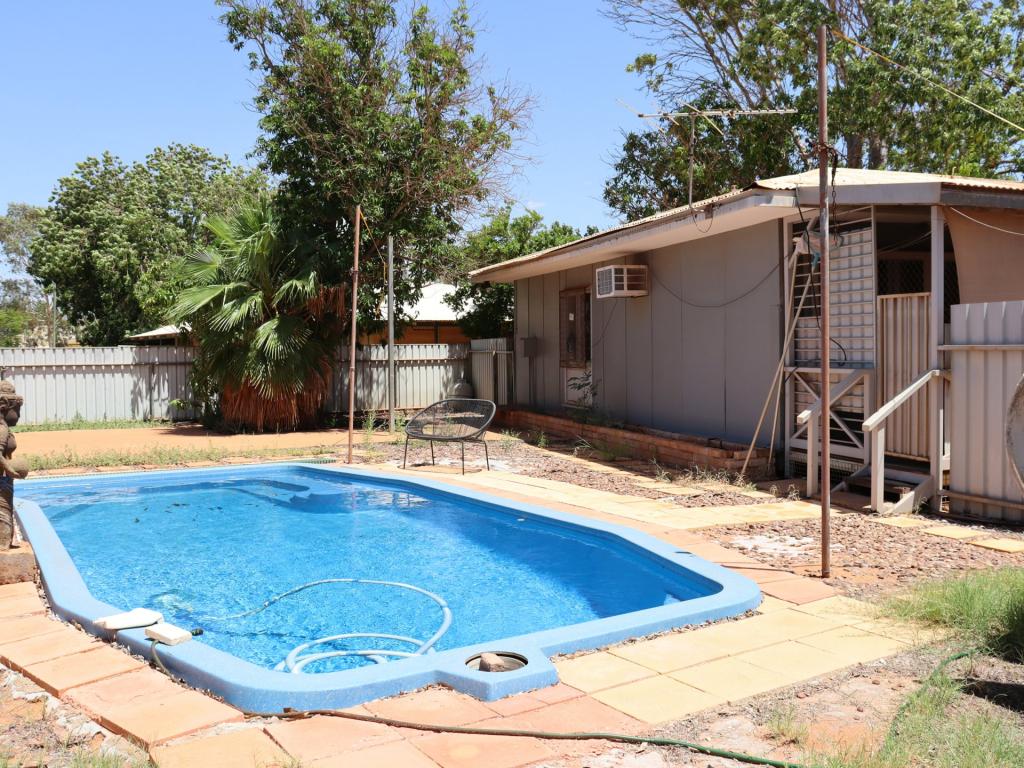
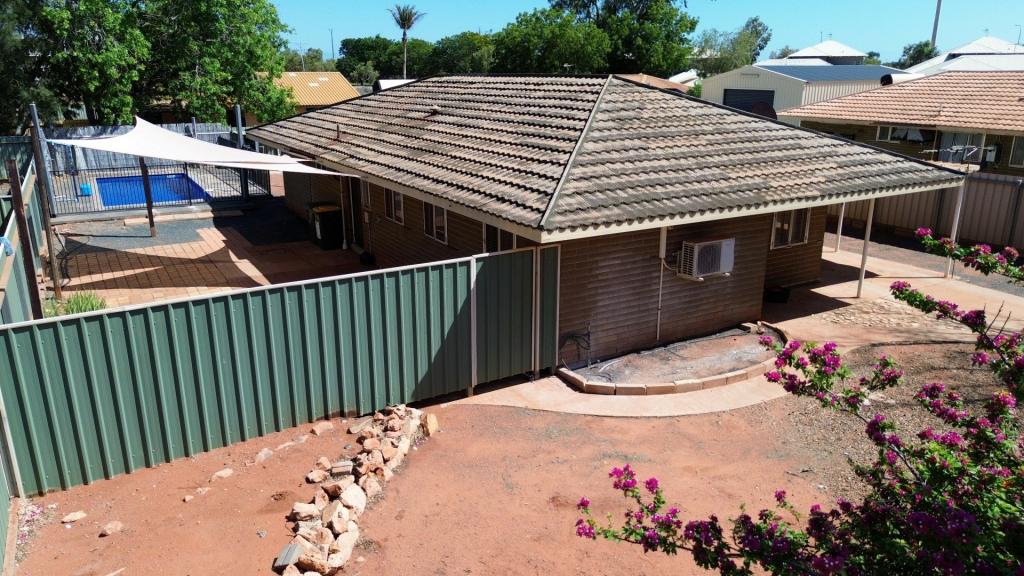
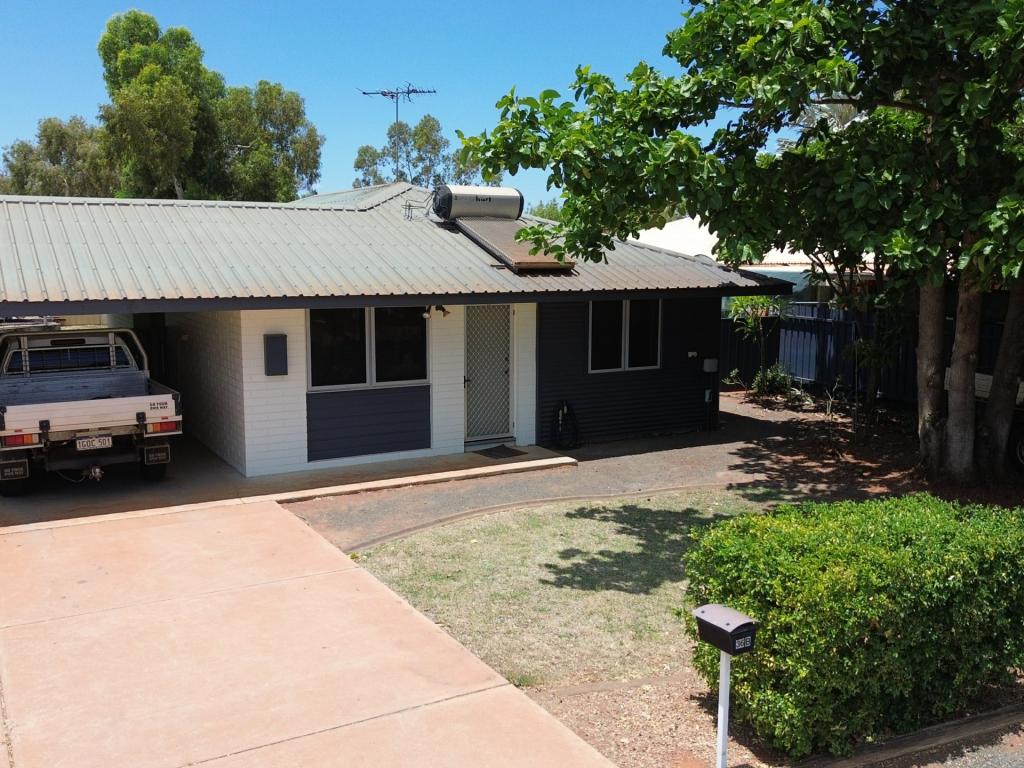
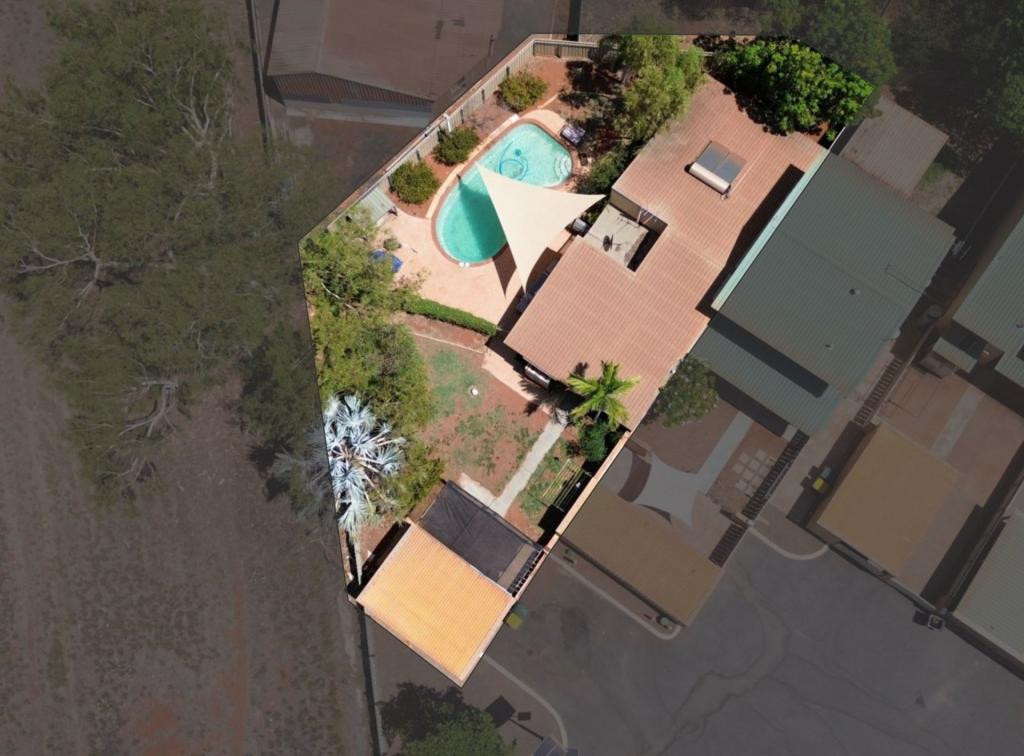
Brand New 4-Bedroom Home for Rent – Modern & Spacious!
Property Details for 5 Crake St, South Hedland
5 Crake St, South Hedland is a 4 bedroom, 2 bathroom House with 1 parking spaces. The place is currently for rent with LJ Hooker Port Hedland.
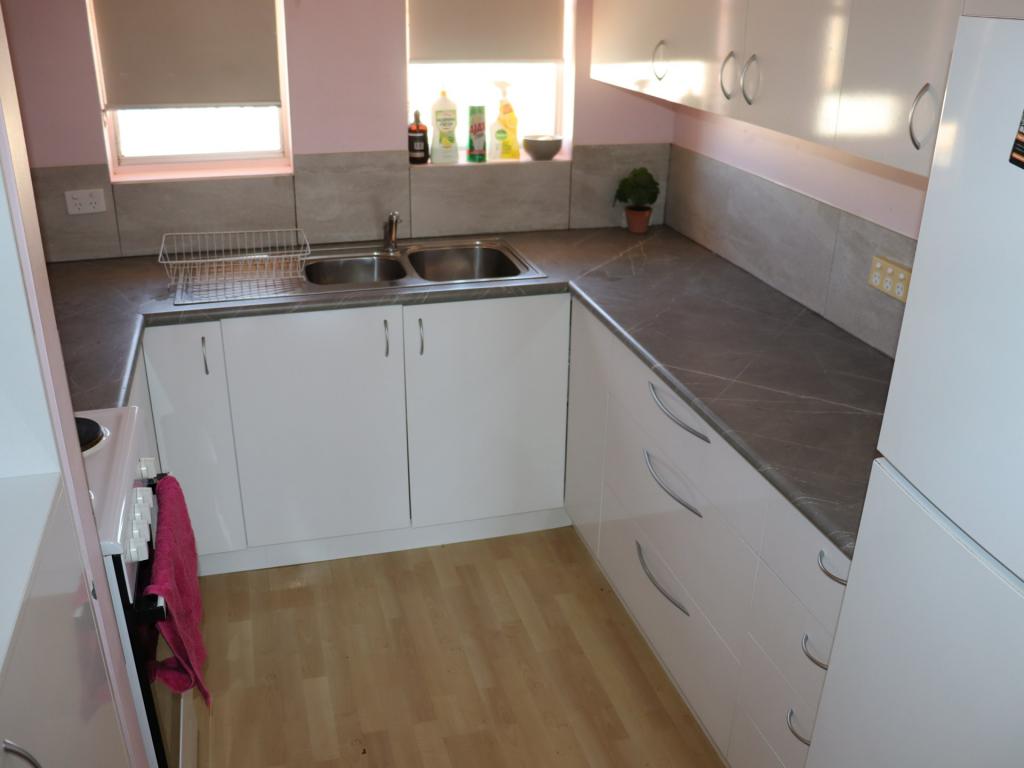
Property Features
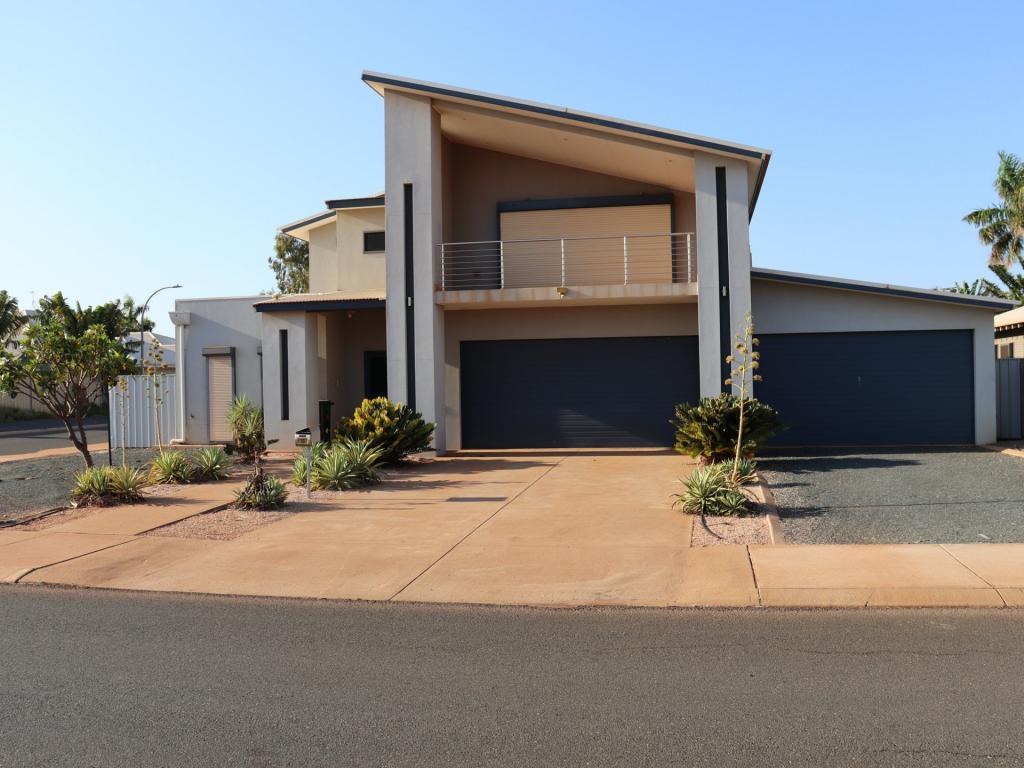
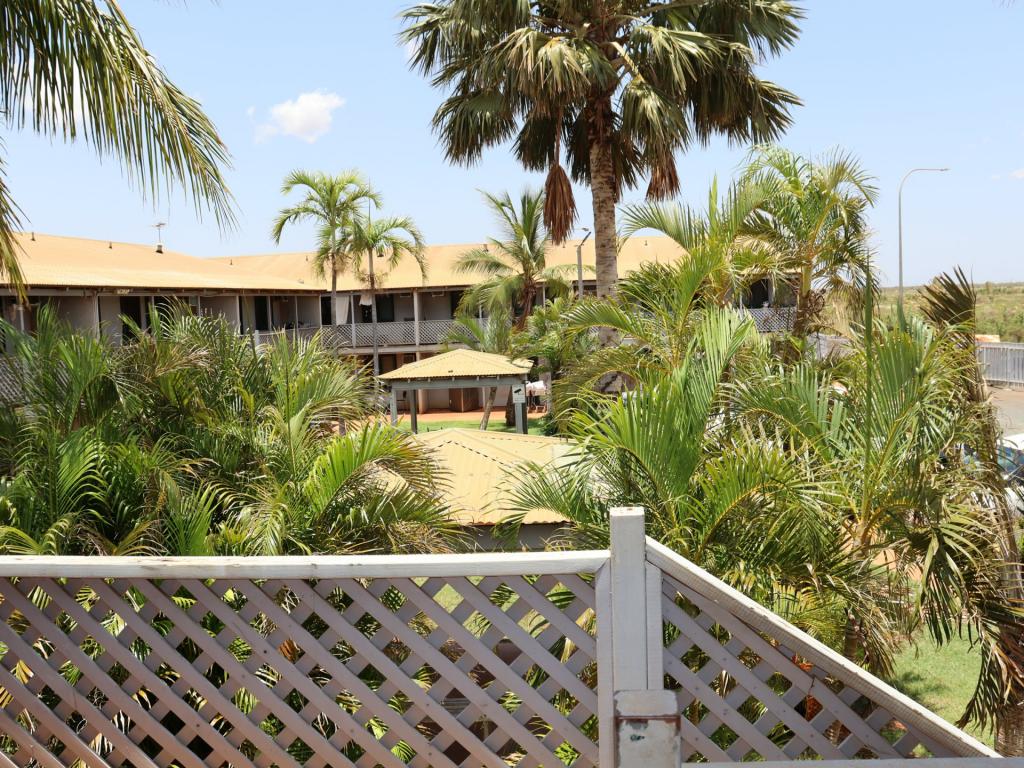
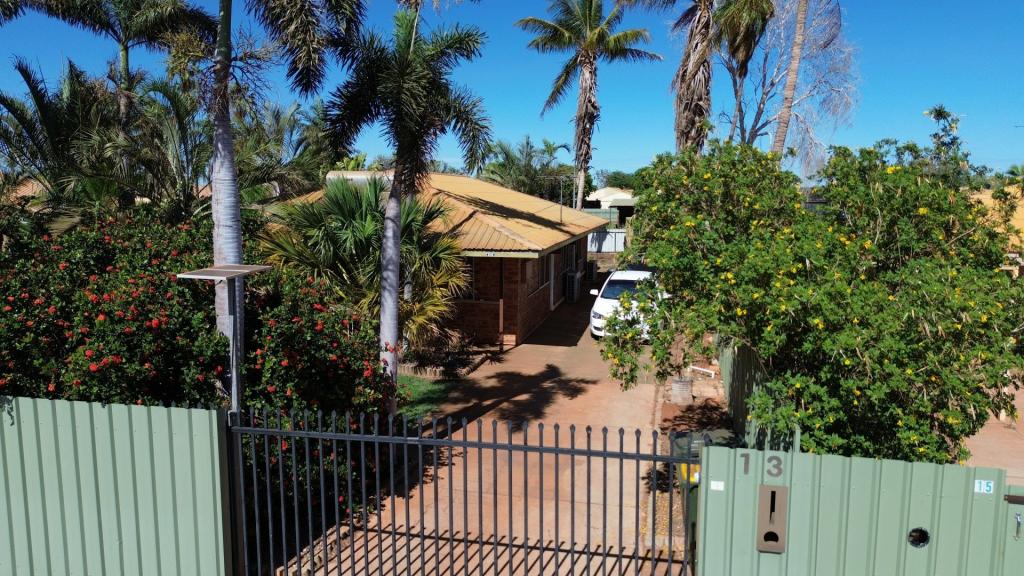
Other properties by this agency


About South Hedland 6722
The size of South Hedland is approximately 22.8 square kilometres. It has 8 parks covering nearly 5.3% of total area. The population of South Hedland in 2011 was 9,376 people. By 2016 the population was 9,475 showing a population growth of 1.1% in the area during that time. The predominant age group in South Hedland is 30-39 years. Households in South Hedland are primarily couples with children and are likely to be repaying $3000 - $3999 per month on mortgage repayments. In general, people in South Hedland work in a trades occupation. In 2011, 28.5% of the homes in South Hedland were owner-occupied compared with 16.8% in 2016.
South Hedland has 5,280 properties. Over the last 5 years, Houses in South Hedland have seen a 123.00% increase in median value, while Units have seen a 218.89% increase. As at 28 February 2025:
- The median value for Houses in South Hedland is $463,564 while the median value for Units is $322,622.
- Houses have a median rent of $950 while Units have a median rent of $708.
What's around 5 Crake St, South Hedland


Suburb Insights for South Hedland 6722
Market Insights
South Hedland Trends for Houses
$464k
9.33%
View Trend$950/W
11.38%
South Hedland Trends for Units
$323k
17.09%
View Trend$707.5/W
13.69%
Neighbourhood Insights
Age
Population 9,475
0-9
19%
10-19
11%
20-29
18%
30-39
20%
40-49
14%
50-59
12%
60-69
5%
70-79
1%
Household Structure
Occupancy
© Copyright 2025 RP Data Pty Ltd trading as CoreLogic Asia Pacific (CoreLogic). All rights reserved.
This product uses cookies and other similar technologies to improve and customise your browsing experience, to tailor content and adverts, and for analytics and metrics regarding visitor usage on this product and other media. We may share cookie and analytics information with third parties for the purposes of advertising. By continuing to use our website, you consent to cookies being used. View our Privacy Policy here.
X