29 Cable CourtBlacks Beach QLD 4740
Property Details for 29 Cable Ct, Blacks Beach
29 Cable Ct, Blacks Beach is a 4 bedroom, 2 bathroom House with 2 parking spaces and was built in 2012. The property has a land size of 450m2 and floor size of 138m2. While the property is not currently for sale or for rent, it was last sold in October 2021.
Last Listing description (July 2024)
Property Features:
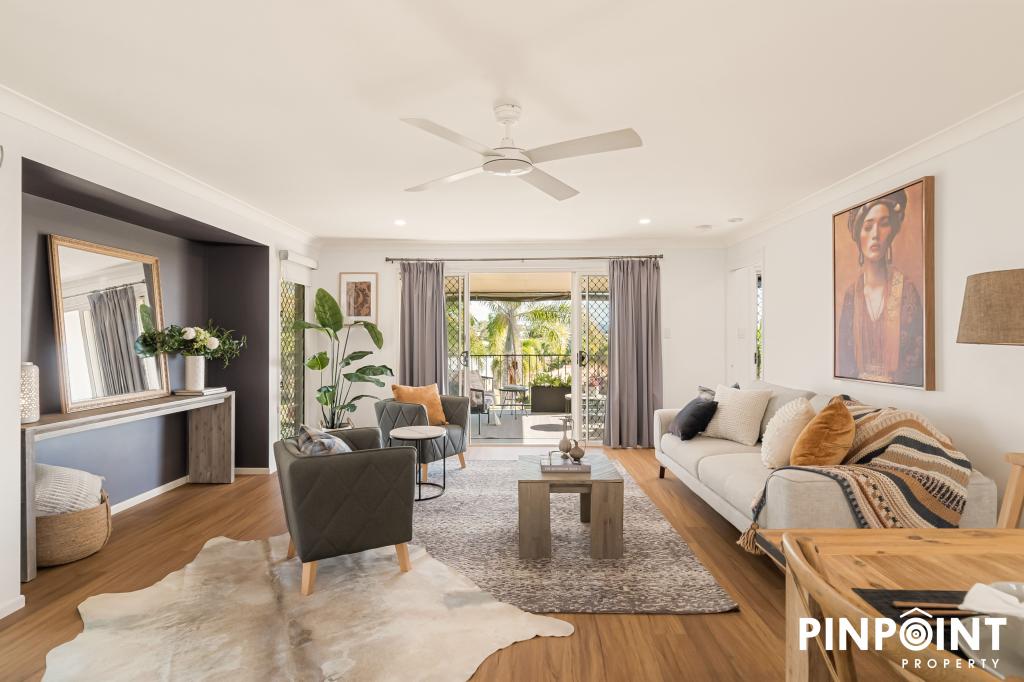
Air conditioned open plan living area and a separate family room
4 bedrooms with built in wardrobes and ceiling fans, main bedroom is air conditioned with ensuite
Outdoor entertaining area
Good size fully secure fenced yard
Pets upon application
To book an inspection of this property please click 'Book an Inspection Time' and follow the prompts. If no times are available you will be notified as soon as one becomes available.
*To apply for this property please click 'Apply Online' or you download an application form from https://explorepropertymackay.com.au/FormsAndDocumentsRent.aspx
Property History for 29 Cable Ct, Blacks Beach, QLD 4740
- 04 Jul 2024Listed for Rent $580 / week
- 26 May 2022Listed for Rent $450 / week
- 15 Oct 2021Sold for $318,500
Commute Calculator
Recent sales nearby
See more recent sales nearby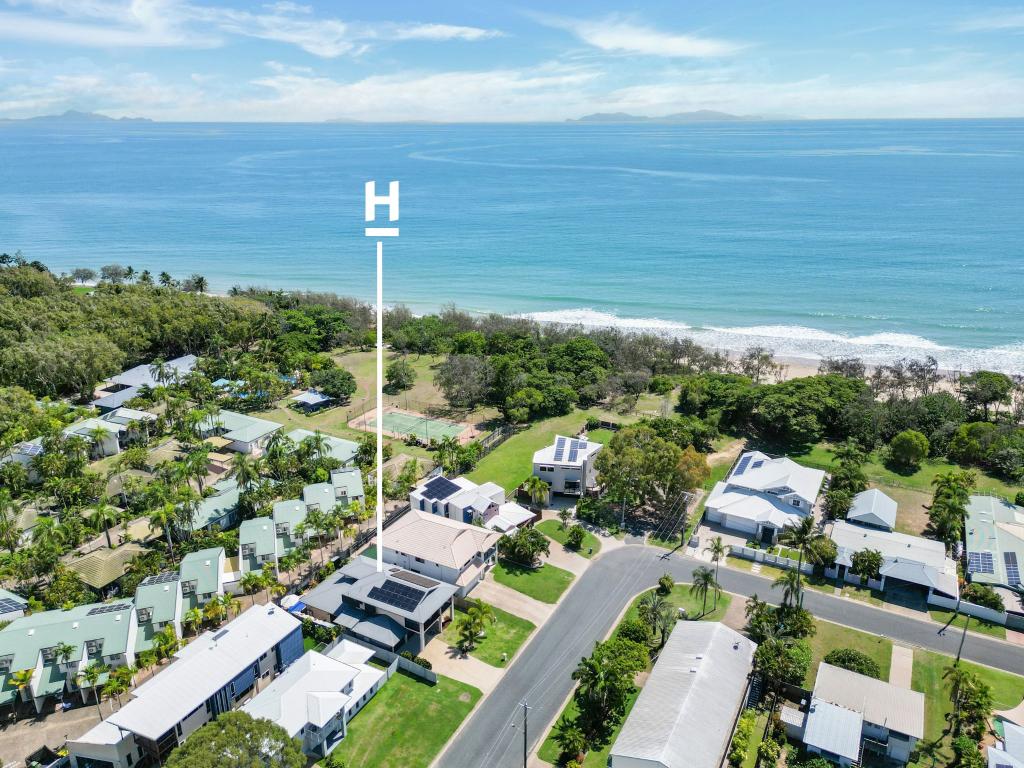 0
0
 0
0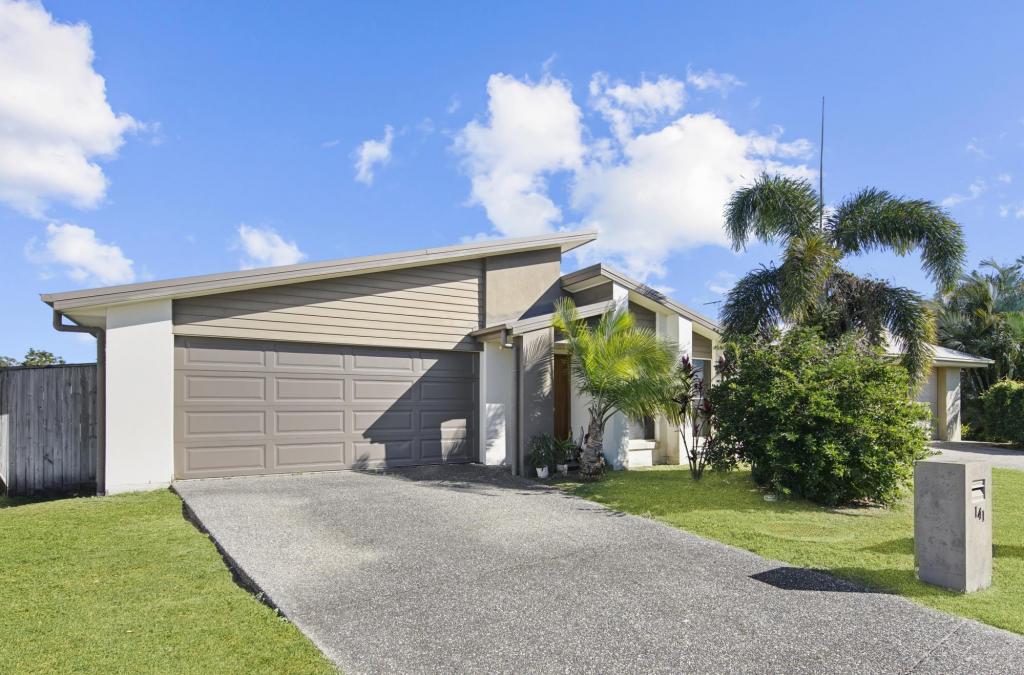 0
0
Similar properties For Sale nearby
See more properties for sale nearby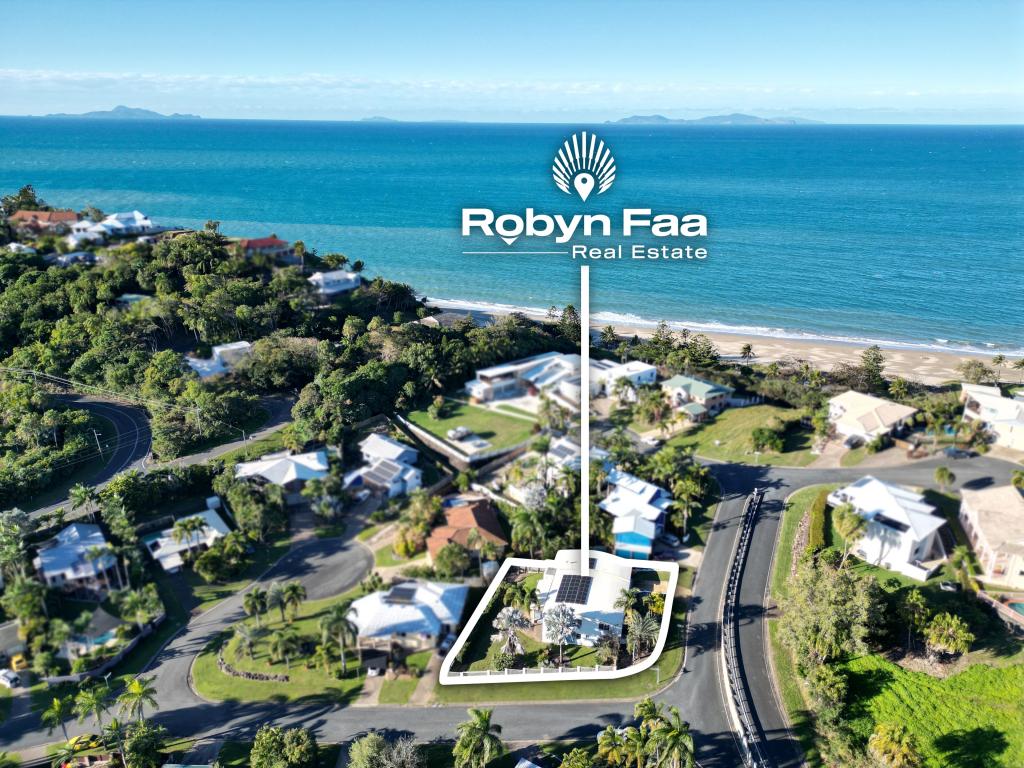 0
0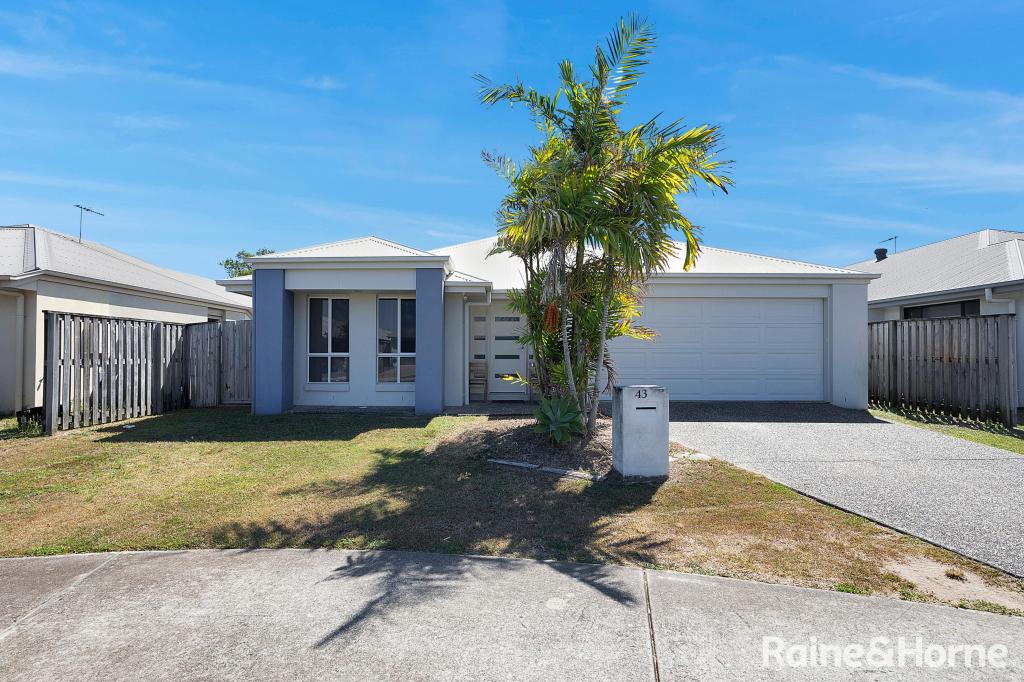 0
0 0
0Similar properties For Rent nearby
See more properties for rent nearby 0
0 0
0 0
0About Blacks Beach 4740
The size of Blacks Beach is approximately 6.5 square kilometres. It has 7 parks covering nearly 4.3% of total area. The population of Blacks Beach in 2011 was 2,871 people. By 2016 the population was 3,847 showing a population growth of 34.0% in the area during that time. The predominant age group in Blacks Beach is 0-9 years. Households in Blacks Beach are primarily couples with children and are likely to be repaying $1800 - $2399 per month on mortgage repayments. In general, people in Blacks Beach work in a trades occupation. In 2011, 53.2% of the homes in Blacks Beach were owner-occupied compared with 37.3% in 2016.
Blacks Beach has 1,882 properties. Over the last 5 years, Houses in Blacks Beach have seen a 49.16% increase in median value, while Units have seen a 48.22% increase. As at 31 August 2024:
- The median value for Houses in Blacks Beach is $565,147 while the median value for Units is $369,756.
- Houses have a median rent of $570 while Units have a median rent of $480.
Suburb Insights for Blacks Beach 4740
Market Insights
Blacks Beach Trends for Houses
N/A
N/A
View TrendN/A
N/A
Blacks Beach Trends for Units
N/A
N/A
View TrendN/A
N/A
Neighbourhood Insights
© Copyright 2024 RP Data Pty Ltd trading as CoreLogic Asia Pacific (CoreLogic). All rights reserved.
This product uses cookies and other similar technologies to improve and customise your browsing experience, to tailor content and adverts, and for analytics and metrics regarding visitor usage on this product and other media. We may share cookie and analytics information with third parties for the purposes of advertising. By continuing to use our website, you consent to cookies being used. View our Privacy Policy here.
X