Property Details for 18/2 Monash Pde, Dee Why
18/2 Monash Pde, Dee Why is a 1 bedroom, 1 bathroom Unit and was built in 1973. While the property is not currently for sale or for rent, it was last sold in July 2022.
Last Listing description (September 2024)
PROPERTY HIGHLIGHTS:
| Live like you're on holiday all year round!
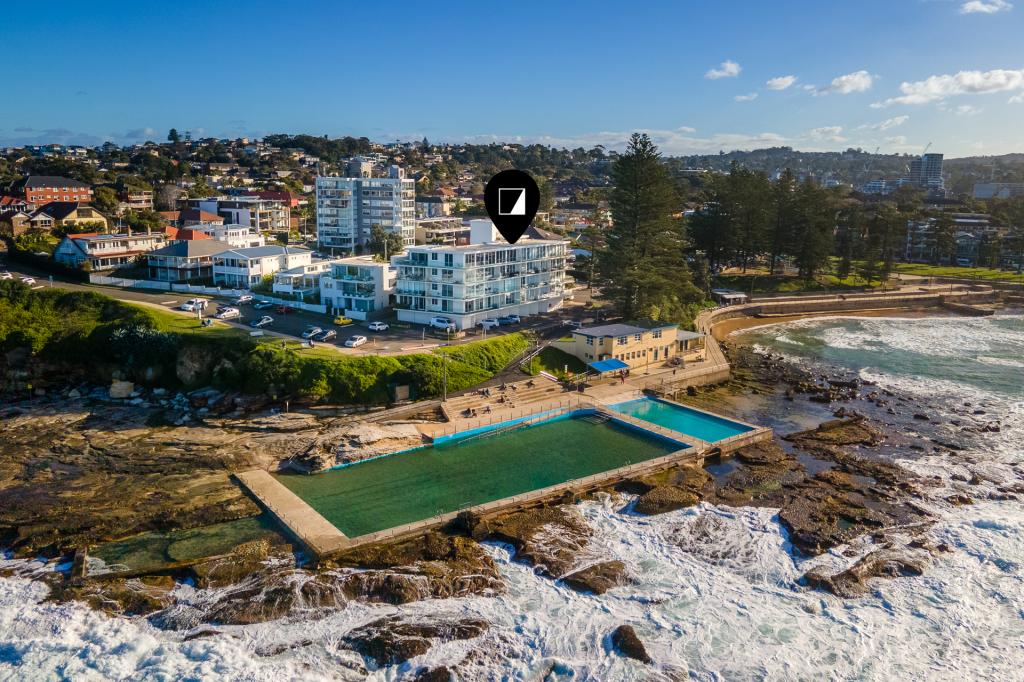
| Luxury space in the iconic "Beach Point" complex
| Doors flow to balcony with ocean views
| Caesar stone kitchen with gas cooktop
| Built-in microwave & dishwasher drawer
| Comes with stainless steel fridge
| Built-in robe/storage cupboard
| Sleek white bathroom
| Ext laundry on same floor with washing machine
| 1 car space
GREAT LOCATION CLOSE TO:
| Dee Why Beach & caf strip
| Local schools and shops
| Public transport express bus to the city
PROPERTY HANDY FACTS:
| No pets
| Stainless steel fridge
| 12 months lease
Property History for 18/2 Monash Pde, Dee Why, NSW 2099
- 24 Jul 2024Listed for Rent - Price not available
- 08 Jul 2022Sold for $300,000
- 23 Dec 2020Listed for Rent $450 / week
Commute Calculator
Recent sales nearby
See more recent sales nearbySimilar properties For Sale nearby
See more properties for sale nearby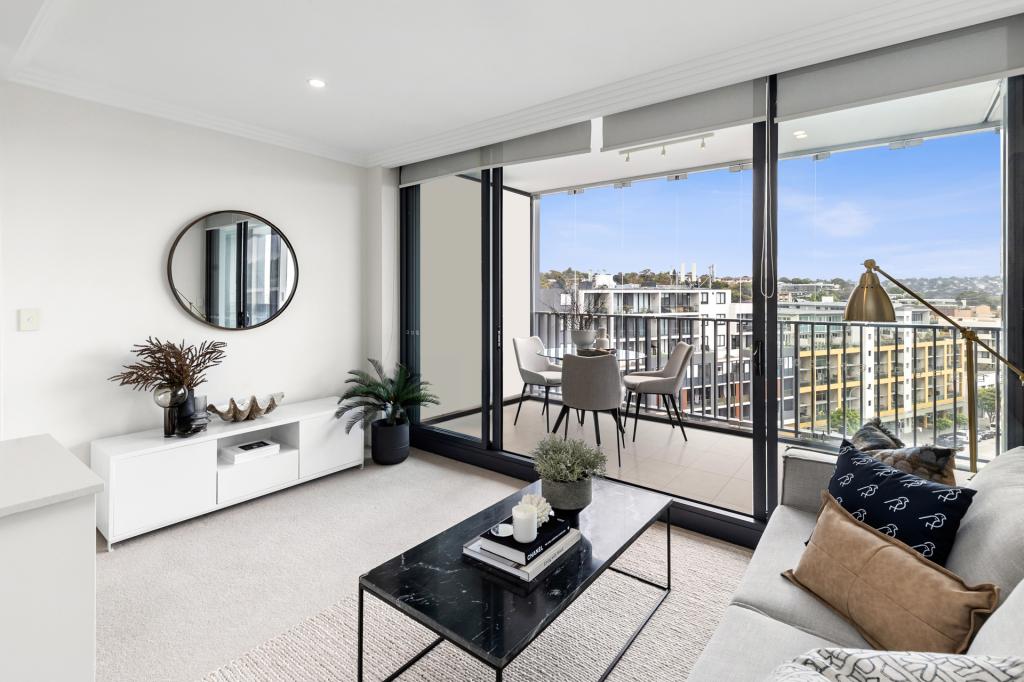 0
0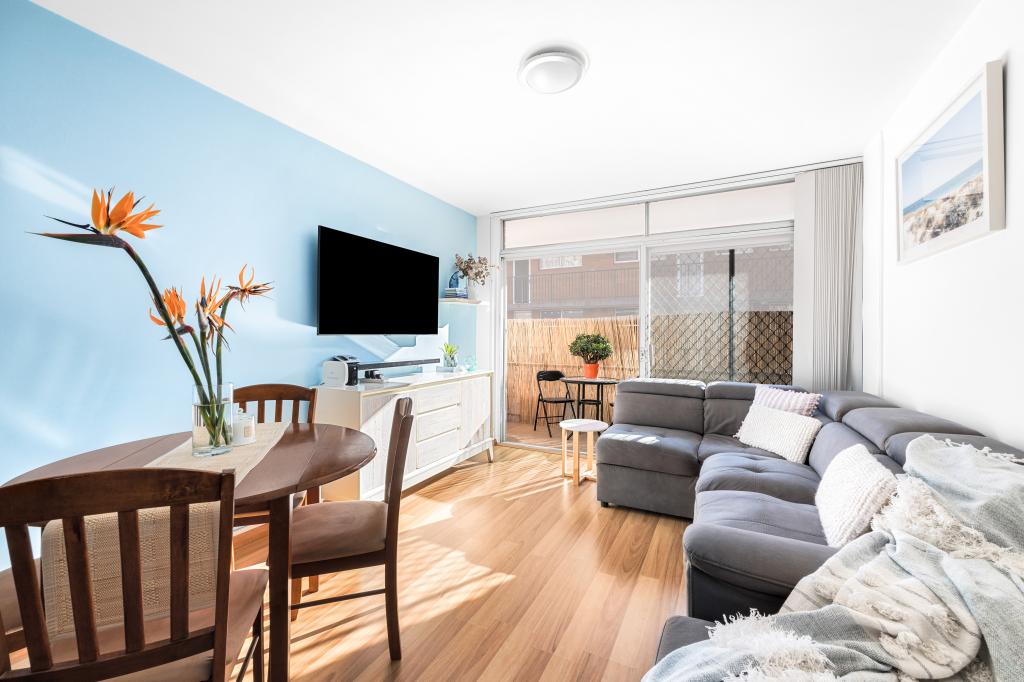 0
0
 0
0
Similar properties For Rent nearby
See more properties for rent nearby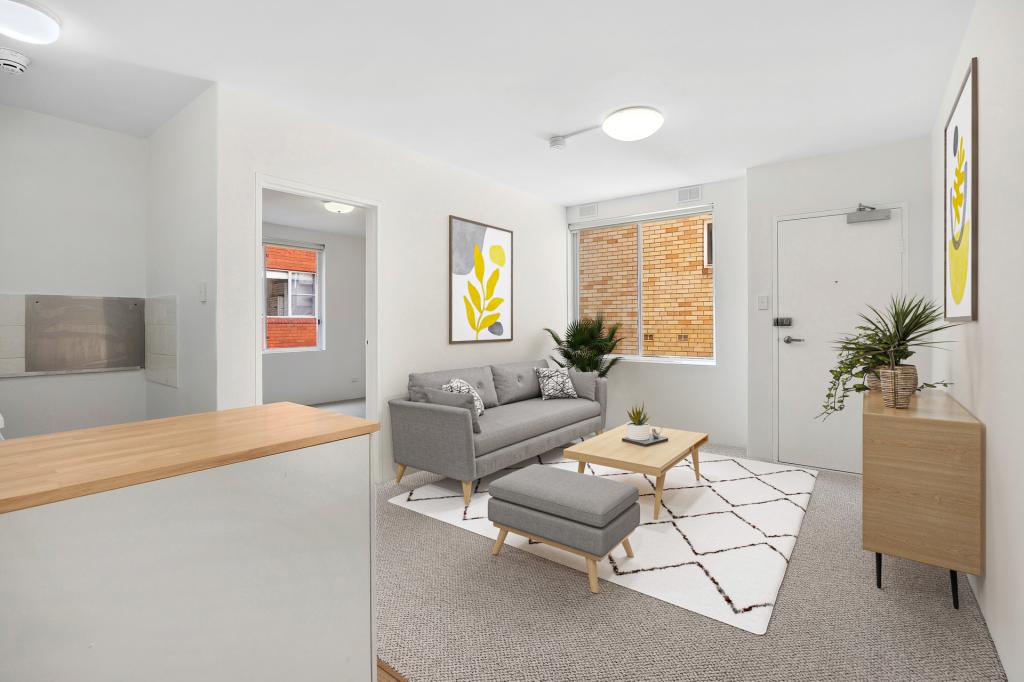 0
0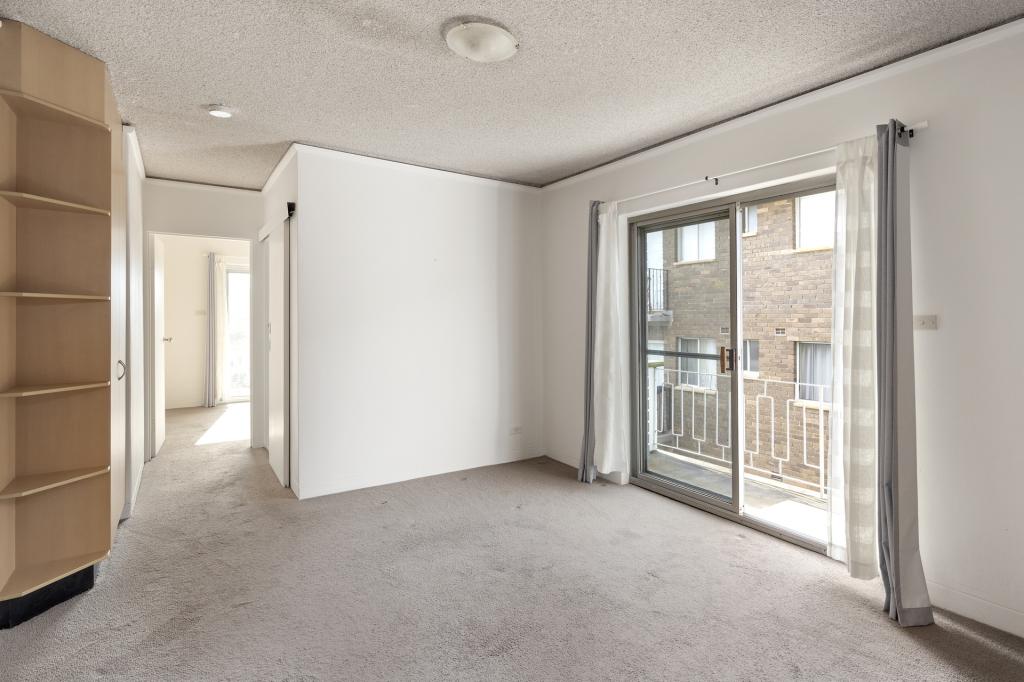 0
0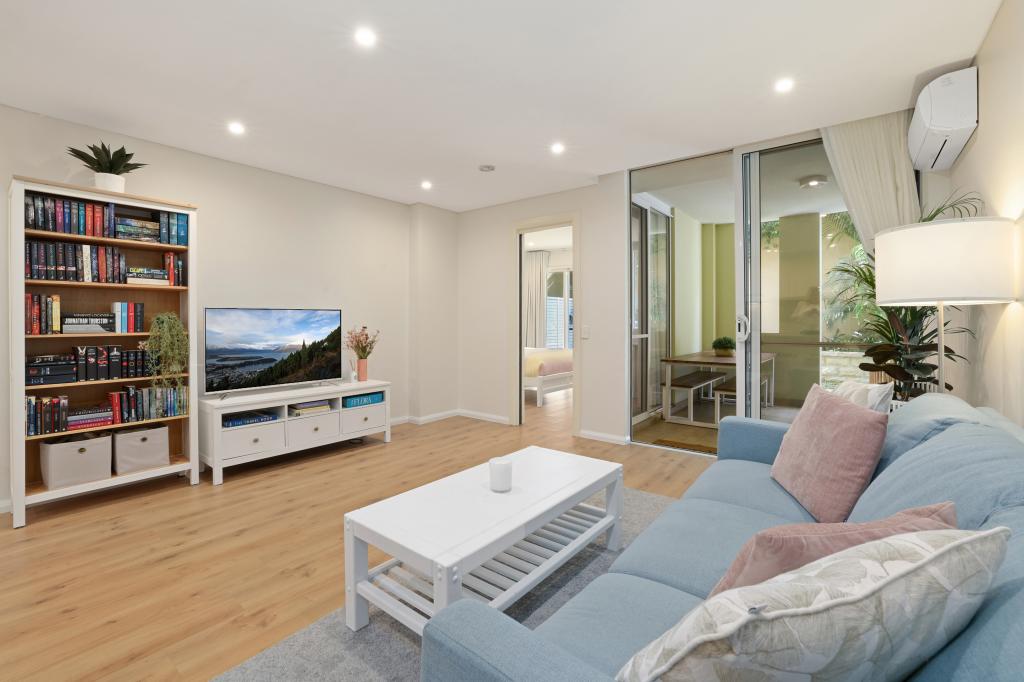 0
0About Dee Why 2099
The size of Dee Why is approximately 3.4 square kilometres. It has 11 parks covering nearly 15% of total area. The population of Dee Why in 2011 was 19,838 people. By 2016 the population was 21,524 showing a population growth of 8.5% in the area during that time. The predominant age group in Dee Why is 30-39 years. Households in Dee Why are primarily childless couples and are likely to be repaying $1800 - $2399 per month on mortgage repayments. In general, people in Dee Why work in a professional occupation. In 2011, 54.3% of the homes in Dee Why were owner-occupied compared with 50.3% in 2016.
Dee Why has 12,941 properties. Over the last 5 years, Houses in Dee Why have seen a 70.74% increase in median value, while Units have seen a 37.20% increase. As at 31 July 2024:
- The median value for Houses in Dee Why is $2,623,021 while the median value for Units is $1,003,446.
- Houses have a median rent of $995 while Units have a median rent of $699.
Suburb Insights for Dee Why 2099
Market Insights
Dee Why Trends for Houses
N/A
N/A
View TrendN/A
N/A
Dee Why Trends for Units
N/A
N/A
View TrendN/A
N/A
Neighbourhood Insights
© Copyright 2024 RP Data Pty Ltd trading as CoreLogic Asia Pacific (CoreLogic). All rights reserved.
This product uses cookies and other similar technologies to improve and customise your browsing experience, to tailor content and adverts, and for analytics and metrics regarding visitor usage on this product and other media. We may share cookie and analytics information with third parties for the purposes of advertising. By continuing to use our website, you consent to cookies being used. View our Privacy Policy here.
X